
![]()
email:
consultants@geosphereinc.com
124 north auburn road auburn, mi 48611 tel: (989) 662-6149
fax: (989) 662-7701
copyright ©1990-2007 geosphere inc
are gridded using Surfer for Windows software; smoothing and contrasting color contouring schemes are selected as needed. Contour maps are labeled with objects of known interference (fences, sewer lines, etc) and interpreted features using information from field notes and suspected conditions.
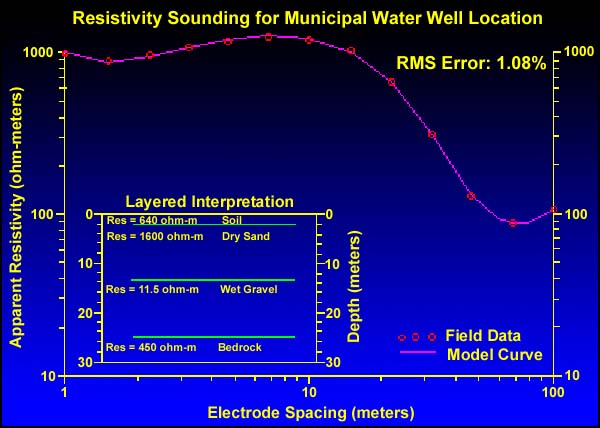
Resistivity sounding data are inverted, using in-house computer software, producing a model of discrete layers, each of constant resistivity (or conductivity). The inversion routine computes theoretical curves based on a trial model and adjusts the model parameters iteratively until it achieves asatisfactory match with the field data. Geologic interpretation of electrical conductivity data involves matching observed anomalies with characteristic responses to known features. Constraining information, such as well data, outcrops, or other geophysical data, is very useful in producing a comprehensive, coordinated interpretation.